In this Getting Started procedure, we will use the StreamInsight Event Flow Debugger to view how the events are internally processed in StreamInsight. We assume that you have performed the preceding Getting Started procedures already.
- As before, right-click on “SimpleDAStreamInsightApplication” project in the Solution Explorer, and select “Debug -> Start new instance”. This will build and run the program. Observe the results in the console window, but let the application run.
- From the Start menu, select “Microsoft StreamInsight 2.3 -> StreamInsight Event Flow Debugger”.
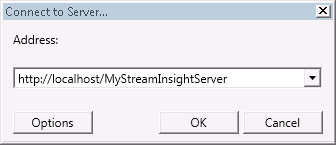
- From the debugger menu, select “File -> Connect to Server… (Ctrl+K)” command.
- In the “Connect to Server…” dialog, enter the address as http://localhost/StreamInsight/MyStreamInsightServer , and press OK.
- In the Object Explorer pane of the StreamInsight Event Flow Debugger, navigate and expand nodes as follows:
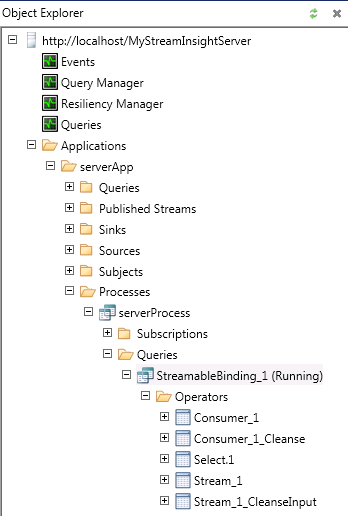
- Under “Applications -> serverApp -> Processes -> ServerProcess -> Queries”, right-click the StreamableBinding_1 query node, and select the “Display Query” command. This will display the query flow chart:
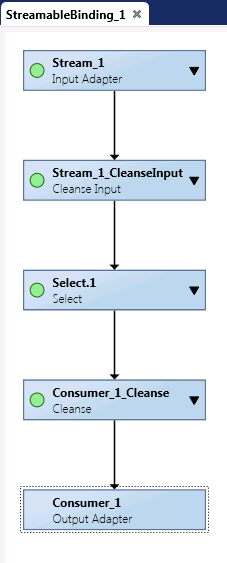
- Press the “Start Recording Events” button on the toolbar. If it happens to be disabled (grayed out), select the “Display Query” command again, as in the previous step.

- Let the events be recorded for some time (e.g. about a minute), and then press the “Stop” button on the “Recording” window:
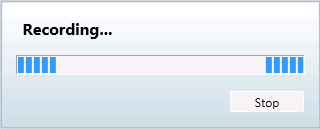
Alternatively, you can press the “Stop Recording Events” button on the toolbar. 
- You can now view the events at various stages of the query processing, by clicking the downwards-pointing triangle in any of the query operators. For example, events on the “Select.1” operator may look like this:
 You can sort and/or filter the events according to various criteria, and the debugger also gives you analysis options, such as Root Cause Analysis or Event Propagation Analysis.
- Close the StreamInsight Event Flow Debugger.
- Switch to the console output window of the application, and press Enter to stop it and close the window.
See Also